Cuius est solum, eius est usque ad coelum et ad inferos.
—Whoever’s is the soil, it is theirs all the way to Heaven and all the way to Hell.
This ancient doctrine is one of the foundations of common law property ownership. While air travel has now rendered the sky common property, in theory American courts still recognize that each landowner is entitled to their slice of our planet from its surface to its center about 4,000 miles beneath them.
The hubris of this notion is clear when we understand how little we have begun to explore the subsurface of the Earth. The deepest point reached by the best efforts of scientific exploration is the 12 kilometer deep, 9 inch wide Kola Borehole—less than 0.2% of the distance to the center of the Earth and narrower than a regulation basketball. Even at these apparently shallow depths, the capabilities of our machinery are pushed to their limit, as drill bits soften and electronic data-loggers melt. The temperatures and pressures at the deeper reaches of our planet render direct observation impossible.
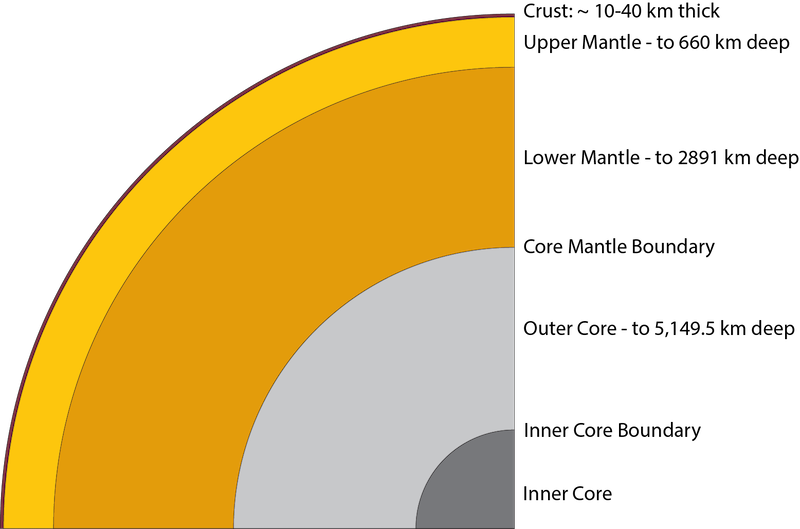
Despite our inability to observe these deeper layers, most schoolchildren have seen a cartoon cross-section of the Earth, with precisely-located structural layers extending to the center. We know that directly below the thin crust of the Earth, the heavier iron- and magnesium-rich minerals of the mantle make up the majority of the volume of our planet. Farther down lies a roiling mass of molten iron and nickel—the Earth’s outer core, responsible for our magnetic field. The outer core remains liquid until, at hellish conditions as hot as the surface of the sun, the immense crushing weight of over 3,000 miles of water, rock and liquid metal re-crystallises the iron and nickel into the solid inner core. The creation of this cross-section is one of the triumphs of 20th century Earth science, and its discovery relied on seismology—the study of seismic waves travelling through the Earth—more than any other technique.

A to-scale cartoon cross section of the Earth. From the surface to the center the Earth is 6371 km (3959 miles) on average.
Jack Muir
Seismic waves are produced in many ways—ranging from traffic, wind and ocean waves, to landslides and mining explosions. The largest and most identifiable waves, that can be clearly seen across the world, are produced by the largest earthquakes. The video below shows a simulation of these waves propagating from an earthquake, and how they look when recorded by modern instruments, known as seismometers. At the surface of the Earth, we only have access to a tiny snapshot of the full information carried by the seismic waves. How then have seismologists been able to use this snapshot to understand so much about the Earth?
This video shows how seismic waves travel from an earthquake and are recorded by seismometers on the surface. The red/yellow waves are the first arriving P-waves, which shake back and forth along the direction of wave propagation. The blue/green waves are S-waves, which shake perpendicular to the direction of propagation. Notice how the waves first travel deep into the Earth and then bend upward towards the surface, and how complicated the waves become as they bounce off different layers within the Earth. The lines at the top of the video show motions that are recorded by seismometers on the Earth's surface.
Oxford University Seismology Lab
To help us peer deep into the Earth, over the 20th century scientists developed tools to accurately determine the size, location and mechanisms of earthquakes, a field which we now call quantitative seismology. Today’s seismometers can measure vibrations as small as an angstrom—the size of a single atom—allowing even medium-sized earthquakes to be sensed around the world. We can further calculate the average speed of a seismic wave if we know its travel time and distance from the source. Different materials have different speeds, which can be indirectly observed via these measurements. Waves travel slowly through loose soils such as those found under Los Angeles and San Francisco, but are up to about 100 times faster in the highly-compacted rock of the deep Earth. Through slow accumulation of average speeds of waves from many earthquakes, recorded at many seismometers, seismologists have built up a blurry, but transformative, view of the Earth beneath us.
Measuring earthquakes we do not feel is essential for understanding the deep and inaccessible Earth those waves propagate through, and this particular technical challenge has a long history. 2000 years ago, Chinese scientists began using instruments to observe earthquakes that they couldn’t themselves feel, however, crucial seismic wave, arrival-timing measurements required for modern seismology was impossible. Development of seismic instrumentation was driven by a few key research observatories in the late 1800s. Key figures included Ernst von Rebeur-Paschwitz, who had recorded the first intercontinental seismic waves in Potsdam, Germany in 1889, and the group of John Milne, James Ewing and Thomas Gray, who pioneered the development of seismic instrumentation in seismically active Japan. By this point, researchers realized that to move beyond the crust, into the depths of the Earth, something more systematic than a few scattered seismometers was needed. Observing the deep Earth would require multiple long-range measurements, so a global collaboration and network of seismometers would be necessary.
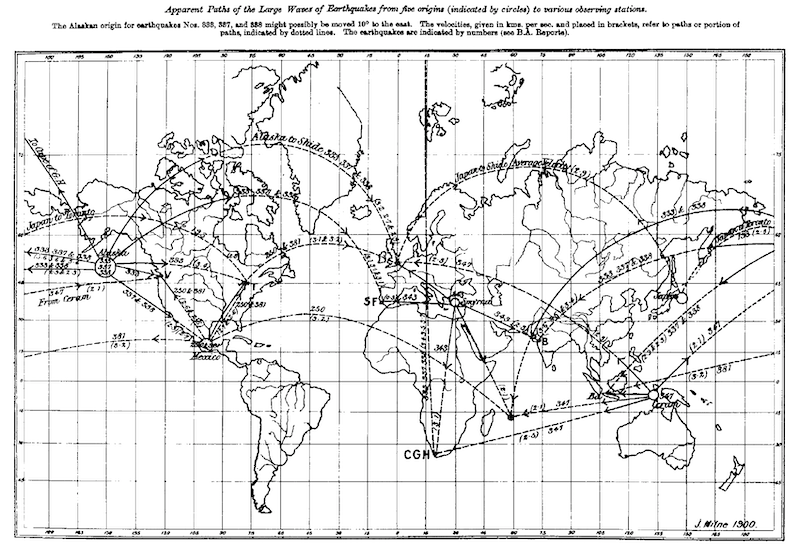
By the turn of the 19th century, enough data was passing through Milne’s country-manor-turned-seismic-observatory on the Isle of Wight to triangulate the location of earthquakes using relative timing information, in much the same way GPS receivers use the travel time of radio signals from orbiting satellites to determine their position today.

Apparent paths of large surface waves recorded by the Seismological Investigation Committee network in 1900. As the name suggests, these waves travel on the surface of the Earth, so on a flat map like this one the paths look curved, like a long-distance flight path. Both the planes and the surface waves are really taking the shortest possible route to their destination. Measurements like these allow the epicenters and event times of earthquakes to be determined by triangulation.
Reports from the Committee of Seismological Investigation (1900)
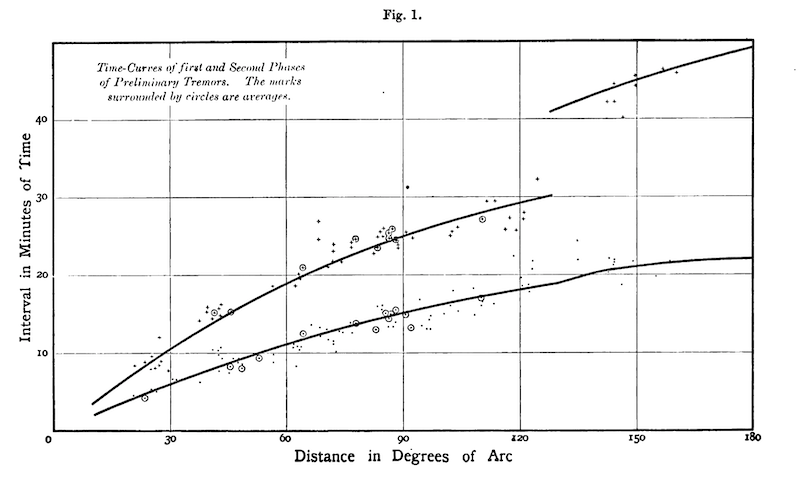
In 1897, one of the most powerful earthquakes since the advent of the modern seismometer occurred in Assam, India. Waves from this earthquake were recorded on seismometers around the world. Richard Oldham, the veteran superintendent of the Geological Survey of India, was tasked with preparing the official report on the earthquake. Using the new global network of seismometers recording the Assam earthquake, Oldham noticed three key phases of the earthquake’s movement: a primary and secondary preliminary tremor, followed by a large wave. Global coverage of seismometer stations allowed him to plot these phases as a function of distance from the epicenter in Assam.
In these data, Oldham immediately saw that the first two phases picked up speed as they travelled further and further away from the earthquake. The only conclusion consistent with the data was that the deep Earth is a veritable superhighway for seismic waves, allowing them to travel at much higher speeds than when near the surface. You can see this effect in the way the waves bend up towards the surface and travel faster as they get deeper in the video above! However, this left an open question—was the Earth made of only one material, that steadily became more compressed with depth and hence faster? Or were there distinct layers, representing different materials, within the Earth?
In the following six years, Oldham collected global data from many earthquakes, eventually publishing his seminal 1906 paper, “The Constitution of the Interior of the Earth, as Revealed by Earthquakes.” This paper plotted the time taken for both preliminary tremors to travel from earthquakes to seismometers all around the world. As expected, seismic waves took longer to reach a seismometer the further they were away from the earthquake. However Oldham’s data also revealed a huge increase in the time taken for the secondary tremors to propagate from the earthquake. These sorts of increases can occur when the speed of a wave changes abruptly. A similar effect creates an apparent bending of a straw where it’s put into a glass of water, caused by a change in the speed of light waves. This abrupt change in the speed of seismic waves was interpreted by Oldham as the first direct evidence of different materials within the deep earth, and today he is generally credited with the discovery of Earth’s outer core.

Light waves moving through air faster than water causes the apparent jump in the straw placed in this glass of water. A similar phenomenon in the Earth's interior leads to sudden increases in the time taken for earthquake waves to reach points on the Earth's surface as you move further away from the earthquake source, providing clear evidence for sudden contrasts in the Earth's makeup deep below the surface.
rookieparenting.com
Ironically, it turns out that the jump in Oldham’s plot in fact has nothing to do with Earth’s core. Instead, the secondary tremors died out at longer distances and were replaced with so-called SS waves, that bounce off the surface of the Earth on their way from earthquake to seismometer. It fell to the great German geophysicist (and later Caltech faculty) Beno Gutenberg to correct the interpretation in 1913. Nevertheless, Oldham established an important principle: the time-distance line that he plotted, and especially branches and steps in it, give us important information about the structure of the Earth.

Oldham's original data, showing the time taken for Earth shaking to reach a seismometer as you get further away from the earthquake. Since the Earth is roughly a sphere, a good unit of distance is the angle at the center of the earth formed by a triangle with the earthquake, the station, and the center of the Earth as its corners—the extreme case of the station and earthquake being directly opposite corresponding to a distance of 180 degrees. For reference, the distance between Los Angeles and New York City is about 35.5 degrees. Dots represent primary tremors, and crosses secondary tremors, as identified by Oldham. Oldham’s primary observation was the big jump in the upper (secondary) arrival curve, which he interpreted as evidence of a change in the material properties of the Earth deep below the surface.
Oldham (1906)
Seismic waves are rich in information, and many more important structures have been discovered from them, most notably an inner core discovered by Danish scientist Inge Lehmann in 1936 in a paper with one of the shortest titles in all of science (“P’”). However, no discovery, even if it was a misinterpreted one, has had as great an impact on our understanding of Earth’s structure as Oldham’s discovery of the core.
Today, seismologists have fully filled out the many time-distance lines that extend out from an earthquake, giving us the full model of the Earth as we understand it today. Recently, we have even been able to understand how seismic waves travel through the Earth without even recording earthquakes directly, using other sources of seismic waves such as the oceans. Without needing earthquakes to generate the information-rich seismic waves, we may be able to peer inside planets and moons where seismicity may be rare or nonexistent, when we deploy seismometers on them.
As amazing as it was to catch our first glimpses inside the Earth, the collaboration of 19th century geophysicists that made it possible has matured into the vibrant and international community of modern seismology, a community utterly reliant on the cooperation of scientists across national boundaries to function. As we look to the next frontiers of scientific exploration, perhaps it is this that is most worth celebrating.
Cover image: NASA, Blue Marble


