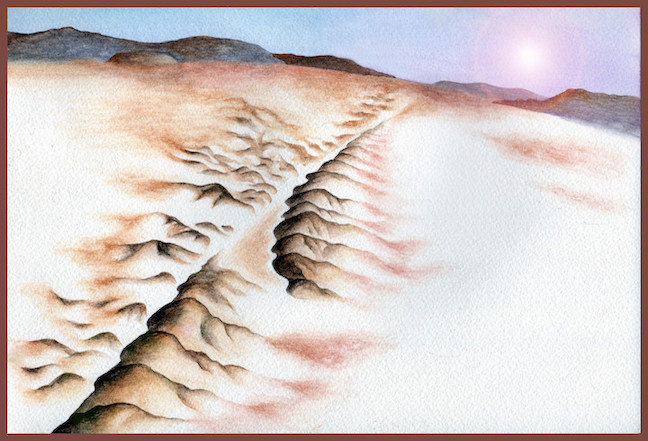
A few days into July, I was dragged out of blissful sleep by the rending of the Californian desert. The largest earthquake in twenty years, another pulsation of California’s irregular heartbeat, had shot seismic waves out in all directions. It was a sudden reminder of the dangers of living in a place where tectonic plates collide. As a scientist who had moved to Los Angeles to study earthquakes, I had always wanted to experience the real thing.
Instead I found myself five thousand miles away, at an earthquake physics conference in the Netherlands, being shaken from my slumber as my roommate told me of the reports of a magnitude 7.1 in California. Immediately I was wide awake. A day earlier we’d seen a magnitude 6.4 strike the remote town of Ridgecrest in the Mojave desert, but California hadn’t been hit by anything as large as 7.1 since the Hector Mine earthquake that had rattled the desert one hundred miles to the south-east of Ridgecrest twenty years earlier. If the earthquake was in an urban area, it could be catastrophic. But to my relief, initial estimates placed the temblor near the 6.4 that had happened the day before, far away from the large cities of southern California.
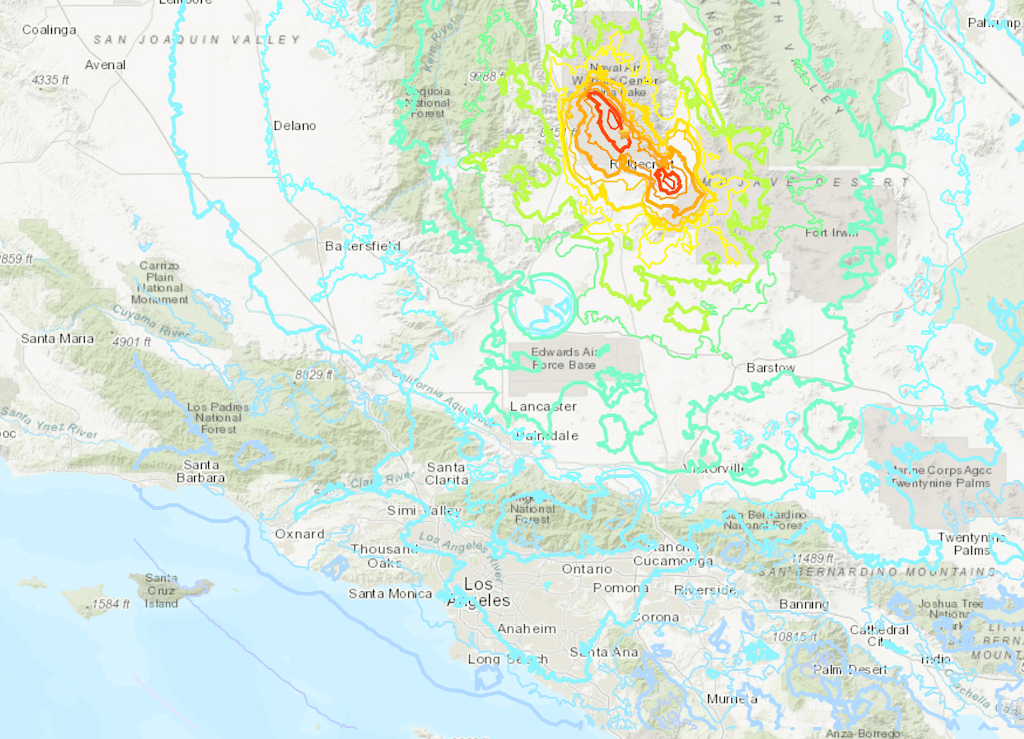
A map of the shaking caused by the July 5th magnitude 7.1 Ridgecrest earthquake, with red being the most intense. Thankfully, Los Angeles was spared the brunt of the earthquake's power.
USGS
Along with my relief, I felt a pang of jealousy. As a graduate student at Caltech, I study earthquakes and the damage they cause, and now during a real-life seismic event I was away from the center of the action. As my fellow scientists got to work and sent me pictures of the world’s media descending on Caltech, I wanted to be back on the ground.
“Welcome home to the land of chaos,” read an email from my advisor when I touched down at LAX a few days later. With my body clock on European time it felt like 4 am, but that didn’t stop me from having enthusiastic conversations about earthquake preparedness with various airport employees. The quakes had left people shaken and pushed seismology to the front of everyone’s minds, giving me a chance to share the recent advances in our science.
Seismologists haven’t been idle in the twenty years since the Hector Mine earthquake. We have deployed an ever denser network of seismometers across California to measure the seismic waves given out by earthquakes. Satellites now take images of the Earth every few days, allowing us to track even the tiniest motions of the Earth’s surface. And two decades of progress have given us a much better understanding of how to process these mountains of data, effectively allowing us to peer through miles of solid rock with an unprecedented degree of detail. With all of these advances, it’s an exciting time to be studying earthquakes.
On my way back from the airport, Twitter was abuzz with preliminary results as researchers around the world tried to piece together what had happened. Groups from all over California were swarming over the fault zone, quickly deploying instruments and measuring where and how much the ground had deformed before the pristine data were lost to the weather and swarms of earthquake tourists. Back at Caltech, work was in full swing; Caltech’s Seismological Laboratory hummed with energy as people pored over a treasure trove of data. We were like crash scene investigators, looking at shards of shattered glass and crumpled bumpers to piece together a blow-by-blow account of what had unfolded.
Earthquakes happen on faults, or planes of weakness in the Earth’s crust. Over decades and centuries, the motion of the Earth’s tectonic plates builds up stress on these weak lines, until, suddenly, they break. The fault break starts at a small point, miles below the surface, when the rocks on one side of the fault start to move relative to the other side. In a matter of seconds, points that were next to each other can slip and be wrenched tens of feet apart. The motion causes other parts of the fault to break, and the earthquake rips through the Earth’s crust at more than a mile a second. As the ground moves, the rupture sends out seismic waves in all directions.
This computer simulation shows what an earthquake on the Hayward fault, near San Francisco, would look like. The Earth starts to move deep underground and the rupture quickly spreads out from that point, sending out seismic waves, which are felt as shaking. A very similar process occured at Ridgecrest.
California Academy of Sciences
Using a precise record of the seismic waves given out by the Ridgecrest quakes, we were able to create a picture of how the ground broke, second by second. The first major earthquake, the magnitude 6.4, roared into life at 10:33 am on July 4th. We traced the earthquake as it started, turned a 90 degree corner, and then angled back along its original direction, breaking more than fifteen miles of faults over twelve seconds.
An earthquake like the magnitude 6.4 is always followed by smaller aftershocks, but there’s also a chance that it sets something bigger in motion. In the 34 hours after the 6.4, our instruments picked up a series of smaller earthquakes before Ridgecrest was jolted once again with a magnitude 7.1 at 8:19 pm on July 5th. That earthquake lasted more than twenty seconds and broke over forty miles of faults, shaking at least 30 million people.
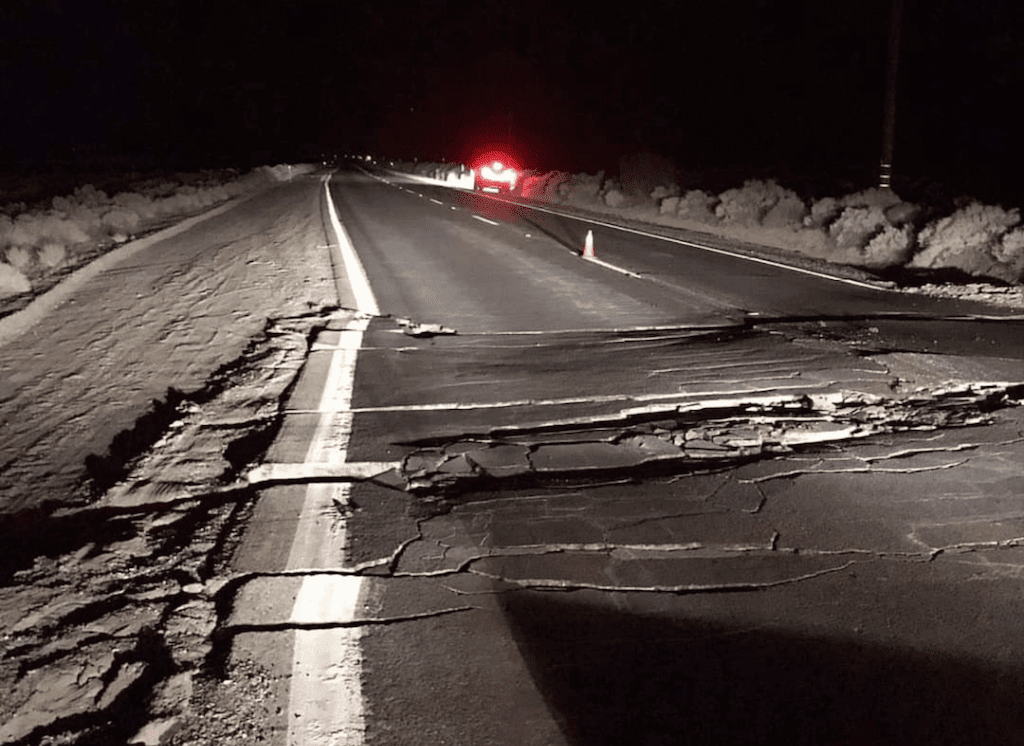
A damaged highway near Ridgecrest. Fault ruptures break everything that they cross as one side of the Earth moves relative to the other.
USGS
The magnitude 7.1 earthquake halted just a few miles short of another fault, the Garlock. Running some 150 miles across southern California, seismologists believe this scar in the landscape can host temblors as large as magnitude 8, although this is unlikely in the near future. It hasn’t ruptured in five hundred years, and a burning question on everyone’s mind was how the earthquakes had affected the Garlock fault.
Ten days after the 7.1, data from satellites and teams on the ground were indicating that the Garlock fault was on the move. Thankfully, this wasn’t a large earthquake; instead, the fault was ‘creeping’—one side was moving slowly past the other, at fractions of an inch per day, without emitting seismic waves. Working with Eric Fielding, a scientist at NASA’s Jet Propulsion Laboratory (JPL), I set out to pin down where the fault was creeping, how much it was moving, and how deep on the fault the motion had penetrated.
To do this we used a technique called interferometric synthetic aperture radar, or InSAR for short. InSAR uses radar images from satellites orbiting hundreds of miles above the ground. By comparing tiny variations in the time the radar beam takes to travel from the satellite to the ground and back, we can measure millimeter-sized motions in the Earth’s surface over months and years. A geologist once described it to me as ‘basically magic,’ and I have to say that every time I look at the results part of me feels the same way.
By measuring these tiny motions in the Earth’s crust we found a small zone, about three miles long, where the fault had crept at or near the surface, causing around an inch of offset across the fault. Over a longer part of the Garlock it looked like the fault had been slowly slipping deeper under the ground, but all of this motion seemed to be confined to the upper quarter-mile of the fault. So while the earthquakes had given the Garlock fault a kick, it hadn’t spurred it into life just yet. What exactly the creep means for future earthquakes on the Garlock is still unclear.
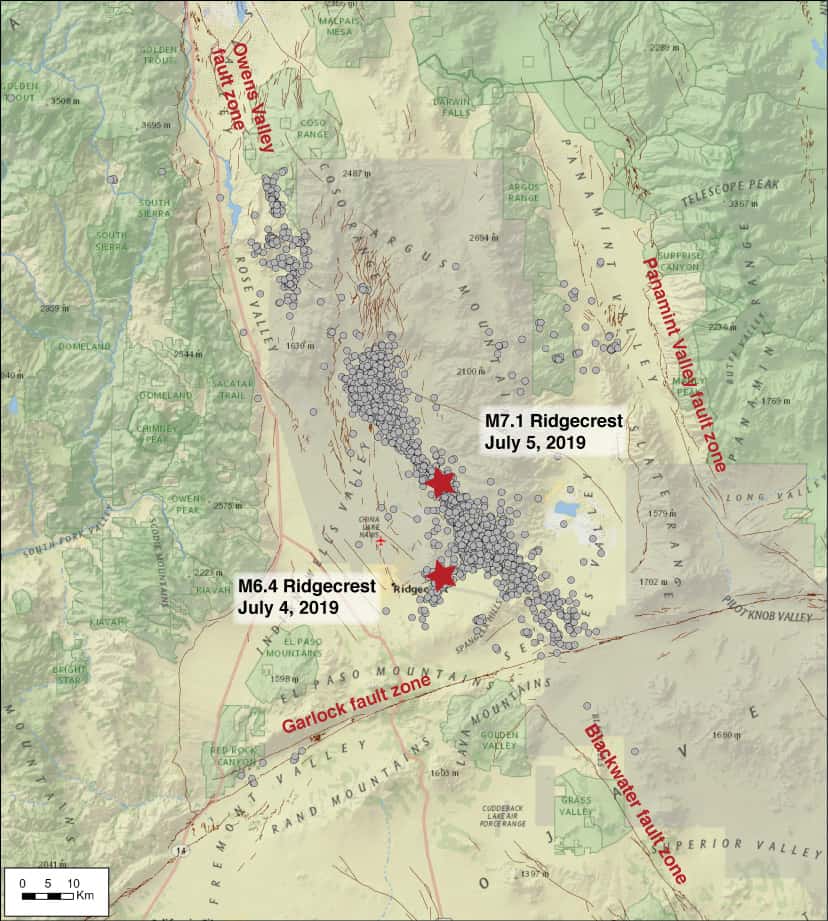
A map of the main Ridgecrest earthquakes (red stars) and aftershocks (grey circles). The Garlock fault is shown in red to the south of the earthquakes.
USGS
The same InSAR technique also showed us how the faults had moved miles underground during the main earthquakes. The ruptures caused permanent deformation to the Earth’s surface over thousands of square miles. Using measurements of this deformation from InSAR and the location of the aftershocks, we calculated that a complex network of more than twenty faults had slipped by up to thirty feet in places and had broken as deep as ten miles beneath the Earth’s surface. Many of these faults hadn’t previously been mapped.
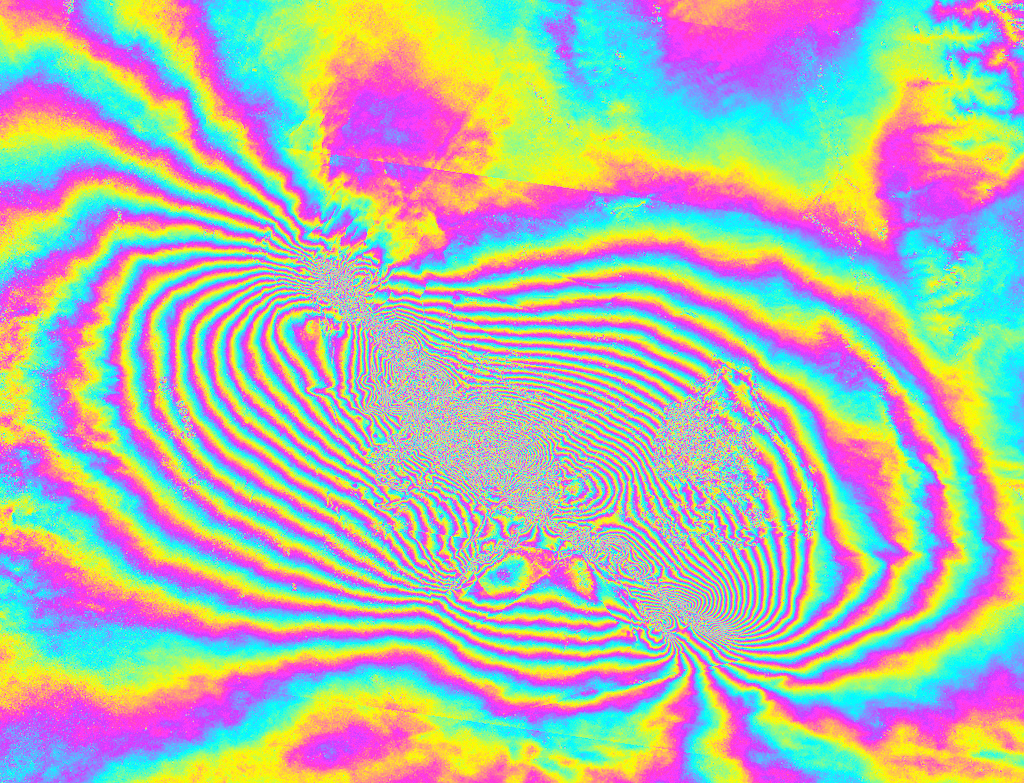
Satellite-based InSAR data that I worked with, known as an interferogram, captures how the ground was shattered by the Ridgecrest earthquakes. Each cycle through the rainbow represents about an inch of permanent ground deformation, with the ground moving as much as ten feet at the surface near the main faults. You can think of the fringes in a similar way to contours on a map, but instead of connecting lines of constant height, they connect lines of a fixed amount of deformation to the ground. As you move from the edges of the image to the center, you step across fringes and move to positions with more and more permanent ground deformation.
Ollie Stephenson/Caltech/NASA JPL/ESA
Thirty years ago, we had a simpler view of earthquakes. They were sudden breaks in the Earth’s crust that ran along straight, simple faults. This meant that to understand how big earthquakes could get, all we had to do was find the straight, simple faults and measure how long they were. The Ridgecrest earthquakes weren’t so straightforward, as they broke through a labyrinthine network of interlocking faults, adding to a growing number of complex earthquakes that have shattered both the ground and our view of how the Earth ruptures.
This complexity means that even if we know where and when the ruptures are going to happen—which we don’t—finding all the faults and deciding which faults in the network these ruptures would break would be a near impossible task. And if we can’t determine the path of the ruptures, we don’t know the size of the potential earthquakes. The Ridgecrest earthquakes weren’t the first multi-fault quakes that we’ve observed, but these are hard scientific problems and we’re still working out how to assess the earthquake threat posed by fault networks.
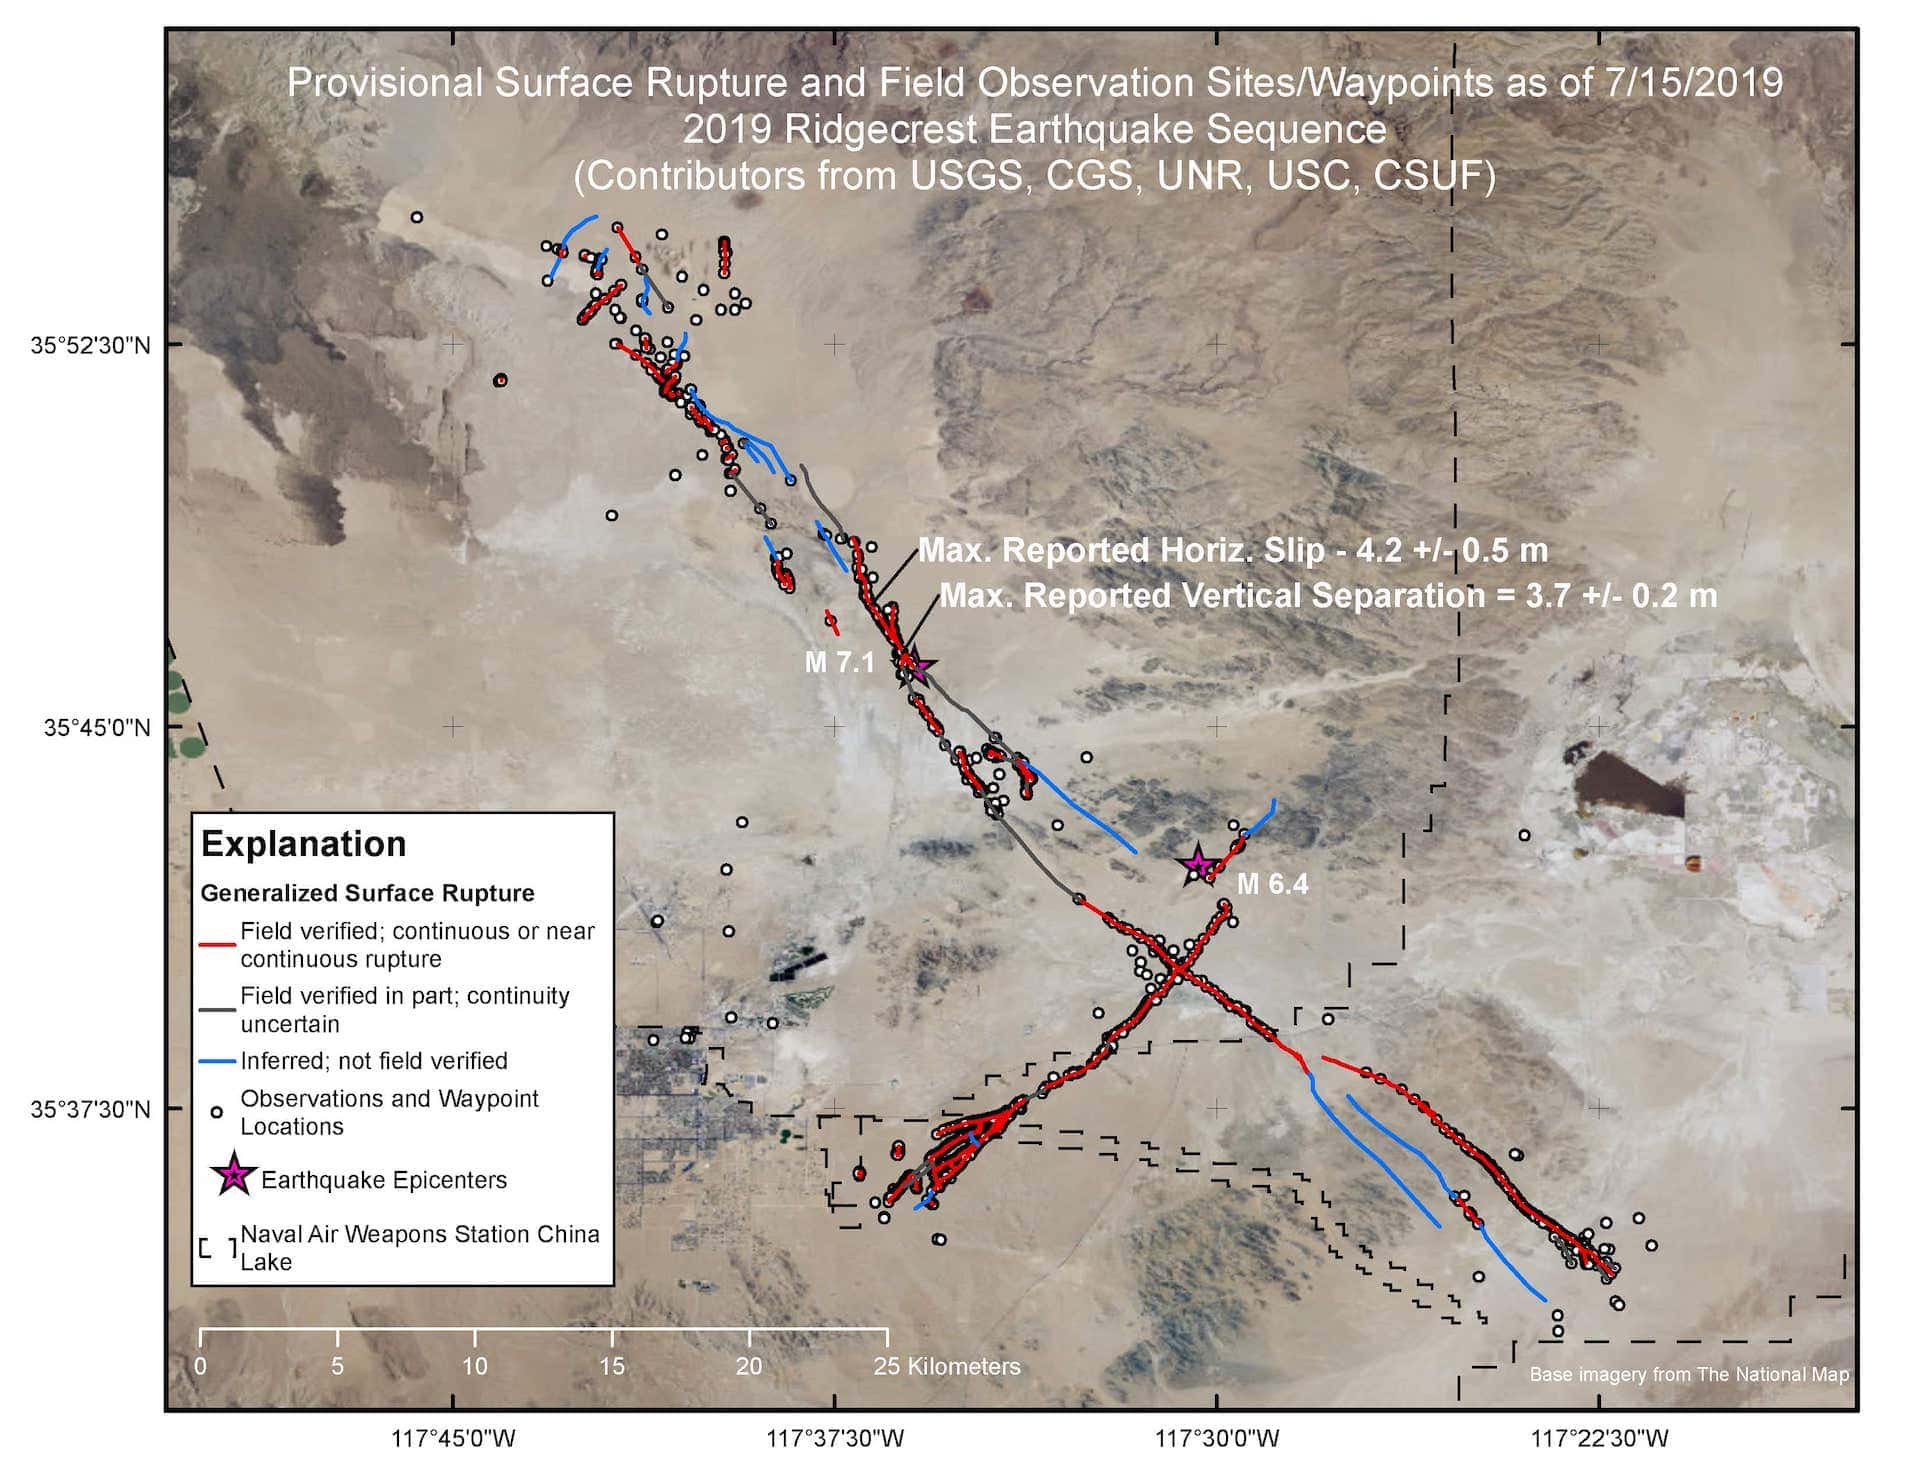
An early map of the surface ruptures produced by the United States Geological Survey. These are the places where the ruptured faults intersect with the Earth's surface. Later mapping has found many more surface ruptures. The viewpoint is very similar to the interferogram in the image above.
USGS
Today our work was published in Science Magazine. The paper, led by Caltech assistant professor of geophysics Zach Ross with co-authors from Caltech and NASA’s JPL, provides an overview of how the Earth broke at Ridgecrest. Given the huge amount of data, however, these earthquakes will be studied for years to come.
It‘s a real thrill to delve deep into nature’s inner workings with such a talented and dedicated group of scientists, and at Caltech I’m enormously grateful to have this privilege. Lots of late nights and early mornings (I think Zach didn’t sleep for about three days after the earthquakes) went by in a blur as we dug into this fascinating event.
But in all the excitement of scientific discovery, it is important to remember that these earthquakes were, first and foremost, a natural disaster with human consequences. While the remoteness of the earthquakes spared California a mass casualty event, it still ripped through communities and left millions of people shaken. For everything that the Ridgecrest earthquakes teach us about the Earth, my hope is that their most lasting impact will be as a reminder to all Californians that when you live on a plate boundary, the ‘Big One’ isn’t a matter of if, but when. Even with everything our studies of the Earth have taught us, it’s impossible to predict the time and place of the next big earthquake. But it’s not hopeless; we can all get informed and get prepared, so that when the Big One hits, we’re ready.
If you live in earthquake country please visit earthquakecountry.org and check out the great reporting done by Southern California Public Radio to find out more about how to prepare for the ‘Big One.’
For more coverage of our work, see the following news articles:
- LA Times: Unprecedented movement detected on California earthquake fault capable of 8.0 temblor
- NASA/JPL: Caltech, NASA Find Web of Ruptures in Ridgequest Quake
- The Guardian: California: July earthquake caused fault to move for first time on record
Our Science paper is titled “Hierarchical interlocked orthogonal faulting in the 2019 Ridgecrest earthquake sequence.” Led by Zach Ross, Co-authors include Zhongwen Zhan, assistant professor of geophysics; Mark Simons, John W. and Herberta M. Miles Professor of Geophysics; Egill Hauksson, research professor of geophysics; Caltech graduate students Benjamín Idini (MS ‘19), Zhe Jia (MS ‘19), Oliver L. Stephenson (MS ‘19, yours truly), and Minyan Zhong (MS ‘18); Caltech postdoctoral scholar Xin Wang; and Eric J. Fielding, Angelyn W. Moore, Zhen Liu, Sang-Ho Yun and Jungkyo Jung from JPL, which Caltech manages for NASA. This research was funded by multiple sources including NASA, USGS, and the National Science Foundation.


